COVID-19 Compilation: Part 27 - September 13-19, 2020
On March 14th, I began posting daily updates to my facebook page, regarding the status of the COVID-19 pandemic. I have used data from worldometer as a primary source for daily and cumulative data, with frequent supplementation from various national and local sites.
This blog post compiles the period of September 13th through September 19th. see https://www.worldometers.info/coronavirus/ for more
SEPTEMBER 13
Is it fair to start speculating whether COVID-19 is waning in the USA?New cases have fallen for 7 straight weeks. That's despite huge surges on college campuses as kids are going back to school, and also despite alleged "super-spreader events" such as the bike rally in Sturgis, South Dakota. Some of the decline may be due to more limited testing, but not all of it. Deaths have fallen 4 straight weeks, and by 30% during that period. While the New York Times has reported "60 deaths since the pandemic began," it goes on to say, "Most of those deaths were reported in the spring and involved college employees, not students." I know of no deaths on college campuses since the start of fall semester, and per the New York Times data the overall case fatality rate on college campuses since the start of the pandemic is 0.07%.
There has been one reported COVID-19 death so far linked to the Sturgis rally, which attracted around 460,000 attendees who mostly took relatively few precautions. For sure, the virus is still spreading globally. We're seeing records in the Middle East, in South America, in France, and in India.
Nor is it like case rates are declining uniformly across the USA. For example, Wisconsin had a record for new cases today with 1,582, the 2nd record in 4 days in the Badger state. Wisconsin also had a positivity rate of 20.5% today, an indicator that the problem there may be worse than the case count (a high positivity rate tends to indicate that not enough tests are being performed to identify all cases). North Dakota had a record total yesterday.
Still, the decline in cases, hospitalizations and deaths has been more sustained than and prior period, and have no clear cause-and-effect such as with the lockdowns in the spring.
There's nothing definitive, by any stretch, and the USA still averaged 750 deaths and 35,000 cases per day last week.
| Today's counts | ||||
|---|---|---|---|---|
| Location | Total Cases | Cases Today | Total Deaths | Deaths Today |
| World | 29.18 million | 243,969 | 927,986 | 3,905 |
| USA | 6.71 million | 31,857 | 198,520 | 392 |
SEPTEMBER 14
| Today's counts | ||||
|---|---|---|---|---|
| Location | Total Cases | Cases Today | Total Deaths | Deaths Today |
| World | 29.44 million | 242,005 | 932,431 | 4,361 |
| USA | 6.75 million | 38,072 | 199,000 | 580 |
SEPTEMBER 15
| Today's counts | ||||
|---|---|---|---|---|
| Location | Total Cases | Cases Today | Total Deaths | Deaths Today |
| World | 29.72 million | 278,856 | 938,446 | 6,000 |
| USA | 6.79 million | 36,447 | 200,197 | 1,197 |
Per worldometer numbers, the USA passed the 200,000 fatality mark today; other sites have the number closer to 195,000.
The world case number will likely surpass 30 million tomorrow.
In the USA, there was a new record for deaths in Virginia, with 96. Per a news report the director of communications for the Virginia Department of Health blamed a backlog: “This is an existing backlog, and VDH is working diligently to identify COVID-19 related deaths using vital record death certificate information."
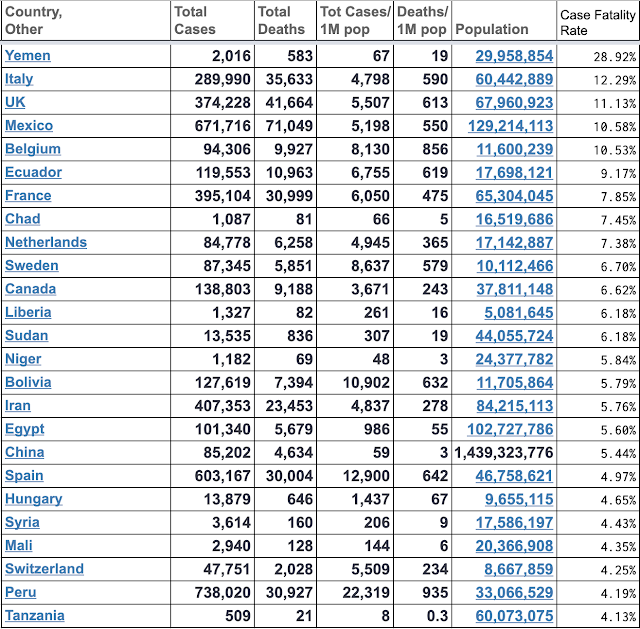
Turning to another topic that seems to have come back to discussions: Case Fatality Rate (CFR). The CFR has declined both worldwide and in the USA over the past several months; worldwide it is 3.16%, per worldometer, and in the USA it is 2.95%.
There are several reasonably clear reasons for the decline: a) improved testing is now catching more cases of those who are asymptomatic; b) more cases are now concentrated in less vulnerable populations (e.g., US students), as more vulnerable populations are better shielded (e.g., nursing home patients); c) treatments have improved. Less clear is whether much of the data is trustworthy, either for case counts or for death counts.
The attached chart shows the 25 countries with the highest CFR to date, among countries with at least 5 million population. Some are clearly not reporting accurately, others were hit early in the pandemic, and there are some that lack testing capacity.
 |
| World Case Fatality Rates, September 15, 2020 |
SEPTEMBER 16
The Math of Herd ImmunityThe math is simple enough. No higher math needed, it's all algebra.
Your population is p.
The percentage of the population needed to have the virus to achieve herd immunity, call that h.
The case fatality rate (CFR), call that c.
The number of deaths you'll get, if you wait for herd immunity, call that d.
Your equation is: d = p * h * c.
It's simple.
I ran a version of that in my nightly update way back on April 3rd. Here was the summary at the time:
"As for the US? We should probably be prepared, in some fashion, for 500,000 deaths. Barring a course correction here, that's where we're headed."
Where did I get the numbers?
I chose 330 million for p.
I chose 60% for h.
And I chose 0.25% for c.
I rounded the answer.
Why 0.25%? It was based on a report in La Repubblica in Italy, which led off with, "The real number of COVID-19 cases in the country could be 5,000,0000 (compared to the 119,827 confirmed ones) according to a study which polled people with symptoms who have not been tested..."
That is, the actual number of cases far exceeded the reported number of cases, by a huge multiple.
A study that I reported on April 11th from The University of Bonn had a similar finding, based on a super spreader event that had happened in Germany, it found a CFR of 0.37% (two deaths reported after the study period would have pushed it to 0.43%).
Had I used 0.37% CFR with 60% population for herd immunity, the overall estimate would have been closer to 750,000 fatalities.
These numbers are sensitive, of course, to when herd immunity comes in. Some recent studies have suggested a much lower percentage; some as low as 20% of the population.
But here's the thing: In order for the calculations to work, there has to be a reasonable expectation that we are working with the actual case and death numbers to date.
Now that it appears the Federal Government of the United States may be going for herd immunity as a strategy, it's important to get this right. So, let's start with the case numbers: In the United States, there are about 6.8 million "total cases" to date. But just as in Italy back in April, that number is dramatically understated. On June 25th, Robert Redfield of the CDC estimated that our official count may be as low as 10% of the actual number of people who have had the virus.
Next, let's go to the CFR. Per the CDC Excess Death tallies, our actual deaths from COVID-19 to date are likely around 240,000. That's higher than the 200,000 that worldometer has, but not by multiples. So, take 240,000, not out of 6.8 million, but out of 60 million (a much likelier case number). That's a 0.4% CFR, which is in line with that Bonn study.
Keep the herd immunity number at 60%.
What do we get? 330 million * 60% * 0.4%.
That's 792,000 dead Americans, a truly horrific number.
If herd immunity is achieved at, say, 40%, that goes down to 528,000. If, in addition, true CFR is, say, 0.2%, that goes down to 264,000... and it's hard not to notice at that point that that combination would suggest that, as a country, we're not all that far away.
On the other hand, if CFR is higher, then that number goes up.
But it's all algebra.
This brings me around to wild-eyed "estimates" coming from people who should know better. People who do not grasp that our current CFR is based on the cases that have been confirmed, not the cases that have happened (which is, again, MUCH higher).
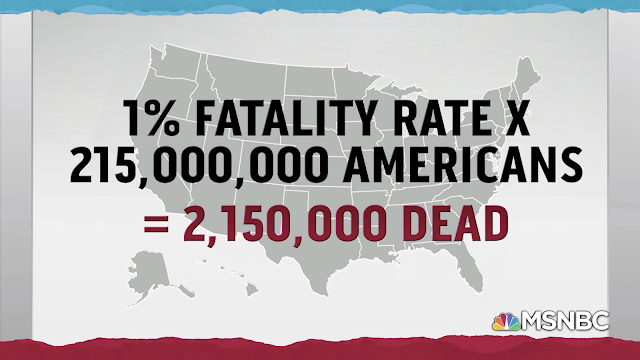
Including, tonight, Rachel Maddow, who spent nearly half her show coming around to the attached graphic, all the while speaking to the current "official" CFR in the United States of nearly 3% and talking of 2.15 to 6.45 million dead Americans.
So let's make this clear: there is no 1% CFR from COVID-19 among TOTAL cases. Every piece of data we have, officially, is from CONFIRMED cases, which dramatically overstates the CFR. Running with wild-eyed estimates of millions of dead Americans based on a poor understanding of how the math works, is a horrible disservice.
 |
| Graphic displayed on MSNBC Rachel Maddow show, September 16, 2020 |
| Today's counts | ||||
|---|---|---|---|---|
| Location | Total Cases | Cases Today | Total Deaths | Deaths Today |
| World | 30.03 million | 307,465 | 944,707 | 6,220 |
| USA | 6.83 million | 40,154 | 201,348 | 1,151 |
SEPTEMBER 17
| Today's counts | ||||
|---|---|---|---|---|
| Location | Total Cases | Cases Today | Total Deaths | Deaths Today |
| World | 30.34 million | 314,752 | 950,280 | 5,579 |
| USA | 6.87 million | 46,295 | 202,213 | 879 |
In Europe, France and Spain both had more than 10,000 cases, and both set new records for cases, according to worldometer. This is the first time both countries have had more than 10,000 cases on the same day. While it should be noted that positivity rates are far lower than they were back in the Spring, we're also seeing deaths rise in Spain: over the course of the past several days the per capita death rate in Spain is higher than in the USA.
Addendum: Due to after-hour adjustments, the total number of cases was revised downward at worldometer to 308,206 (not a record). The case number in Spain was also adjusted downward, to 4,541.
As for the USA, while much of the country continues to trend downward, cases are way up in Wisconsin. Today marked the 4th new single day record for Wisconsin so far this month, with 2,034 new cases. The record prior to today was 1,582. Coincidentally, the President of the United States is holding a rally this evening in an airplane hangar in Wisconsin.
SEPTEMBER 18
| Today's counts | ||||
|---|---|---|---|---|
| Location | Total Cases | Cases Today | Total Deaths | Deaths Today |
| World | 30.69 million | 314,240 | 955,725 | 5,455 |
| USA | 6.93 million | 51,345 | 203,171 | 958 |
SEPTEMBER 19
U-Turn.For each of the 7 weeks leading to this week, cases in the USA declined. Deaths had declined each of the past 4 weeks.
Those trends both ended this week. Some of that is due to reporting backlogs; much of the rise in deaths, in particular, is due to a single backlog in Virginia. The backlog may also be due to delayed reporting after the Labor Day holiday.
Still, 44 states and DC all had increases in cases this week; only Michigan, Louisiana, Virginia, Hawaii, Delaware and Alaska had declines. 28 states also had increases in deaths this week.
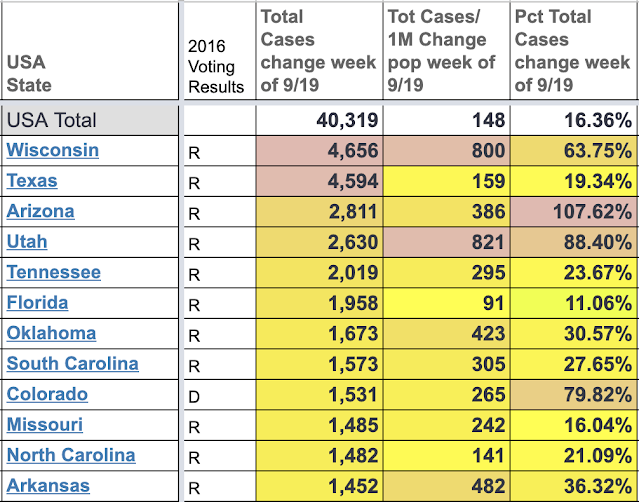
The attached chart shows the 12 states with the largest increase in cases over the past week. As seems increasingly typical of such charts, 11 of the 12 states voted Republican in the 2016 presidential election. On a per capita basis, the top 12 states in terms of rising cases, and 20 of the top 22, voted Republican in the 2016 election, led by North Dakota.
 |
| COVID-19 case changes, week over week |
| Today's counts | ||||
|---|---|---|---|---|
| Location | Total Cases | Cases Today | Total Deaths | Deaths Today |
| World | 30.98 million | 291,160 | 960,872 | 5,142 |
| USA | 6.97 million | 42,533 | 203,824 | 657 |
| This week's counts (items in red indicate new records) | ||||
|---|---|---|---|---|
| Location | Cases | Change | Deaths | Change |
| World | 1,988,431 | +5.4% | 36,597 | +2.8% |
| USA | 287,911 | +16.8% | 5,573 | +5.0% |


Comments